
Create your first Business Monitor
Turn Your Data Into Clear, Custom Reports
In this course
In this course, you’ll learn how to:
- Create your first Business Monitor (also called a model)
- Categorise your data into meaningful financial groups
- Turn raw data into clear, time-based summaries
Build additional reports using dashboards
What is a Business Monitor?
A Business Monitor is your custom financial model inside Advise. It lives in your organisation workspace and can include:
- Actual table (auto-filled with synced data)
- Budget table (manually entered)
- Dashboards (custom reports built with visual widgets)
Common business monitors:
- Operational overview
Balance sheet - Sales report
- Profit & Loss
- Consolidated analysis
Before you begin

Before starting this course, ensure that you:
-
Have a user account and are part of an Organisation workspace
-
Have connected at least one datasource
(If not, complete Course 1 and Course 2 first)
Step-by-step: Create a monitor
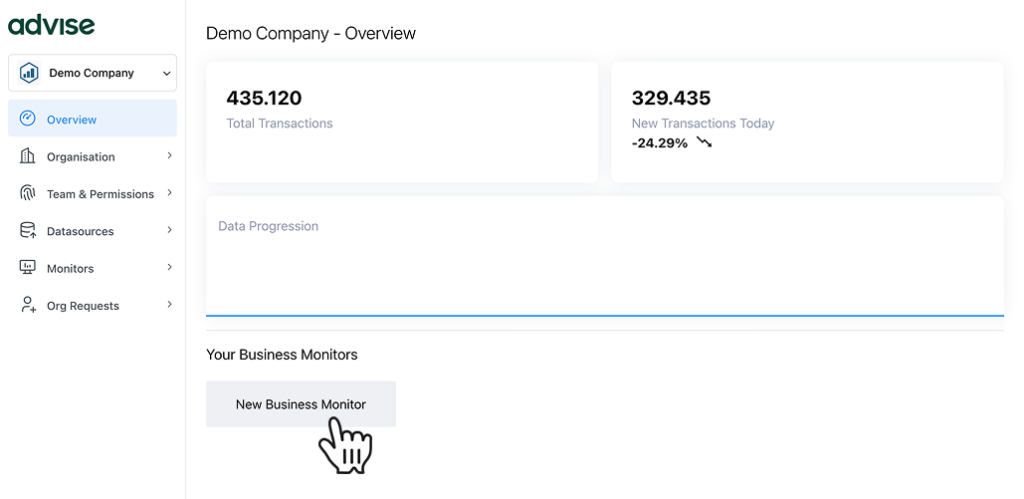
Step 1: Launch the monitor wizard
You can create a new monitor from two places:
- On the Organisation Overview page → “New Business Monitor”
or from the Monitors tab in the sidebar - Clicking this opens the Create New Monitor wizard with 4 steps.
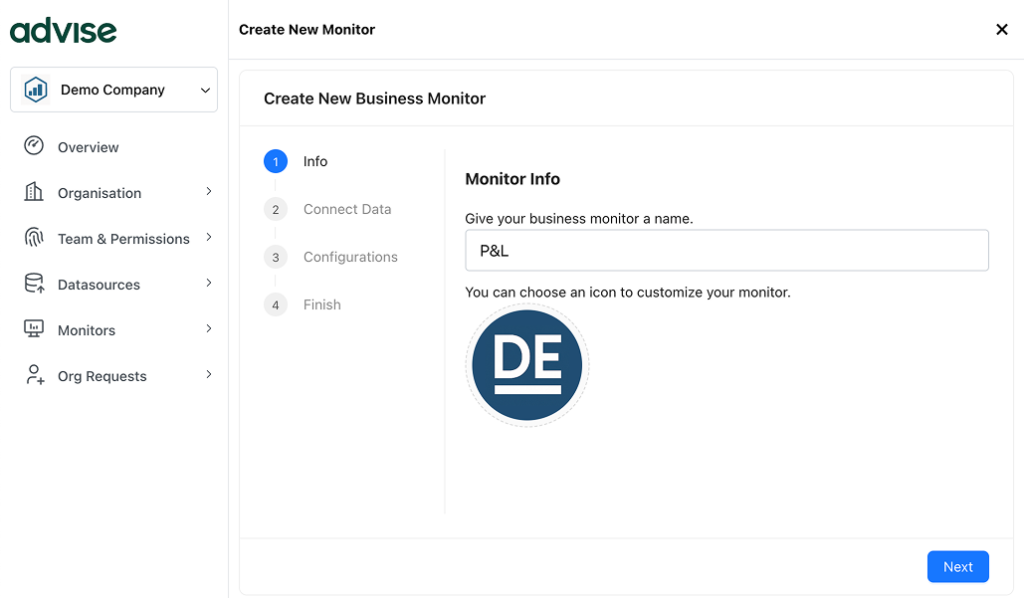
Step 2: Fill In the monitor info
- Give your monitor a name (required)
- Optionally, upload a logo or image for you monitor
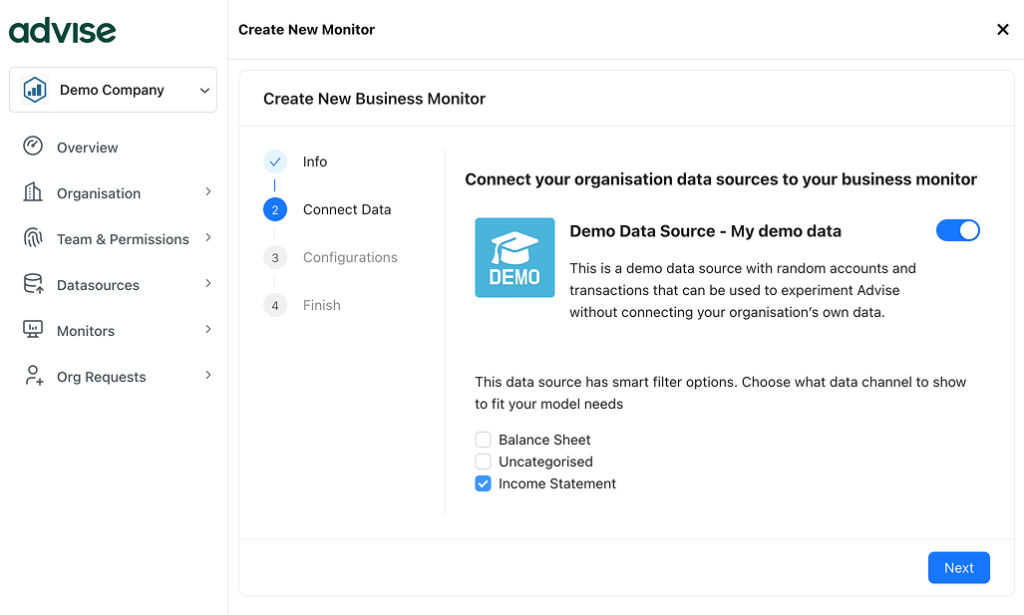
Step 3: Connect data
Toggle on the data sources you want to use. Only data sources that have already been connected to your organisation will appear here.
Select a data channel
When you connect a datasource, you may see a list of data channels. These let you choose what kind of data to bring into your monitor—like income statement accounts or sales by product.
The available channels depend on the datasource, since they’re based on the actual data it provides.
Example – General ledger:
-
Income Statement → includes revenue and expense accounts
-
Balance Sheet → includes assets, liabilities, and equity accounts
Example – Sales:
-
Product Amount → shows revenue by product
-
Customer Volume → shows quantity sold per customer
Choose the channel that best matches the type of report you want to build. In this course we will use the Income statement filter on the demo datasource.
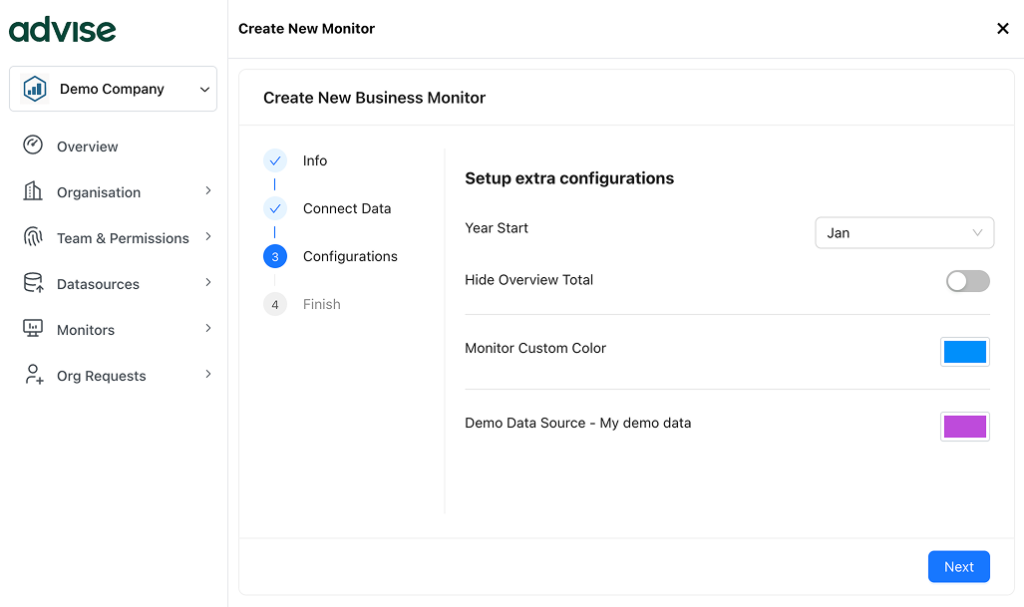
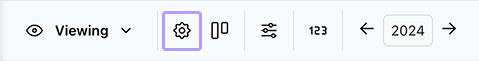
Step 4: Configure settings
- Choose business year start month. Select the month your financial year begins. It’s set to January by default, as this is the most common starting point. This setting ensures your reports, budgets, and comparisons align correctly with your organisation’s accounting period.
- Optional: Hide the total year column
- Set a colour for this monitor and its data source (optional)
Click “next” to complete setup. A confirmation message will appear once your monitor is created. Go ahead and hit the “save and close“ button.
Categorise your data
After creating the monitor, you’ll see a prompt to Configure now. This opens the Categories View—a visual editor where you define how your financial data is grouped and displayed.
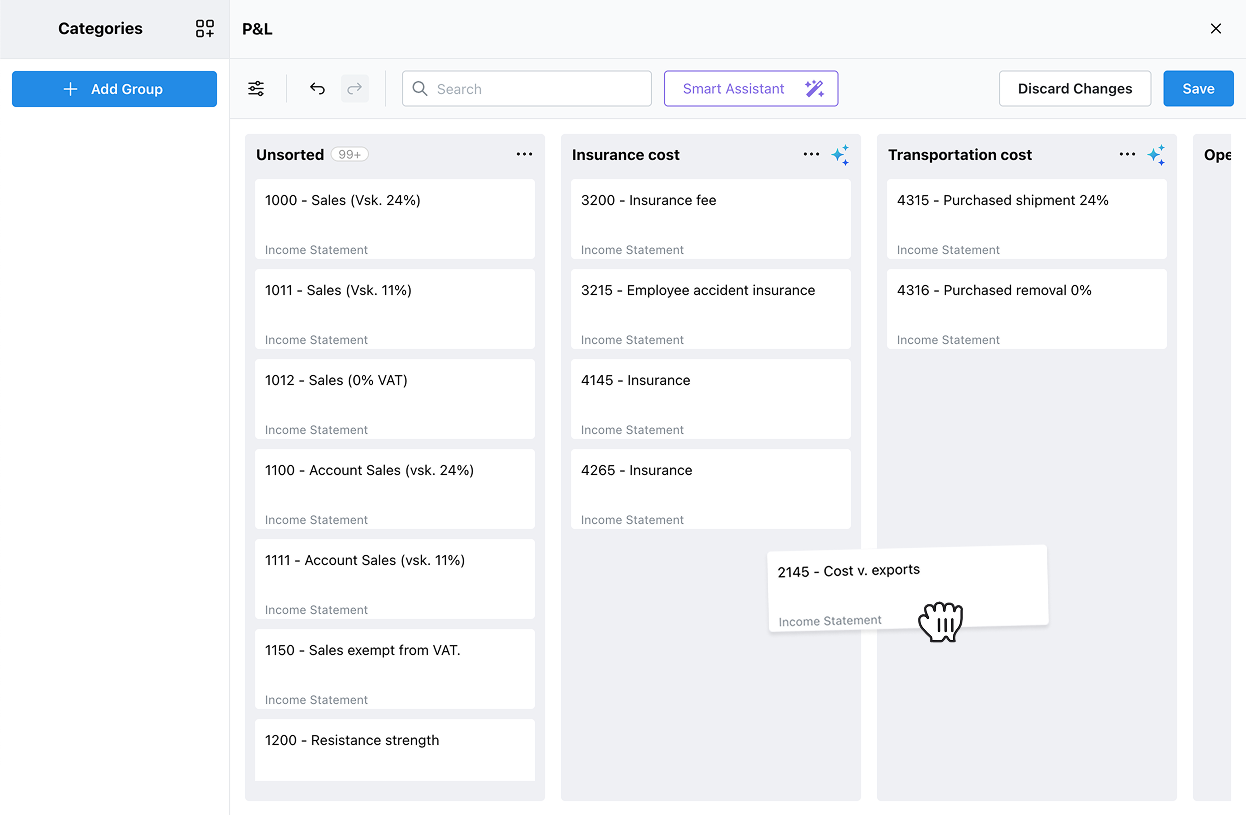
Build your model
You’ll work in a board-style interface (similar to Trello), where each column represents a financial group.
-
Click “Add Group” in the left panel to create a new group.
-
Give each group a clear name—like Sales, Costs, or Operating Expenses.
Start With “Unsorted”
All accounts from your connected datasource(s) are placed in the default Unsorted column.
-
Unsorted is a special system group that will also catch any future accounts added through data sync.
-
Accounts in Unsorted are excluded from your Actual table and not counted in totals.
To include an account in your reports, drag it into the right group.
Use smart assistant (Optional)
You can speed up categorisation using the Smart Assistant to:
Suggest Model Groups
Let AI generate a set of meaningful financial groups based on your data.
This action is only available before you create any groups.
Smart Account Categorisation
Effortlessly organise Unsorted accounts using AI.
This action becomes available once you’ve created at least one group.
When You’re Done
Once all accounts are sorted, click Save and Close. You’ll return to your monitor with the Actual table now populated, reflecting your custom financial structure.
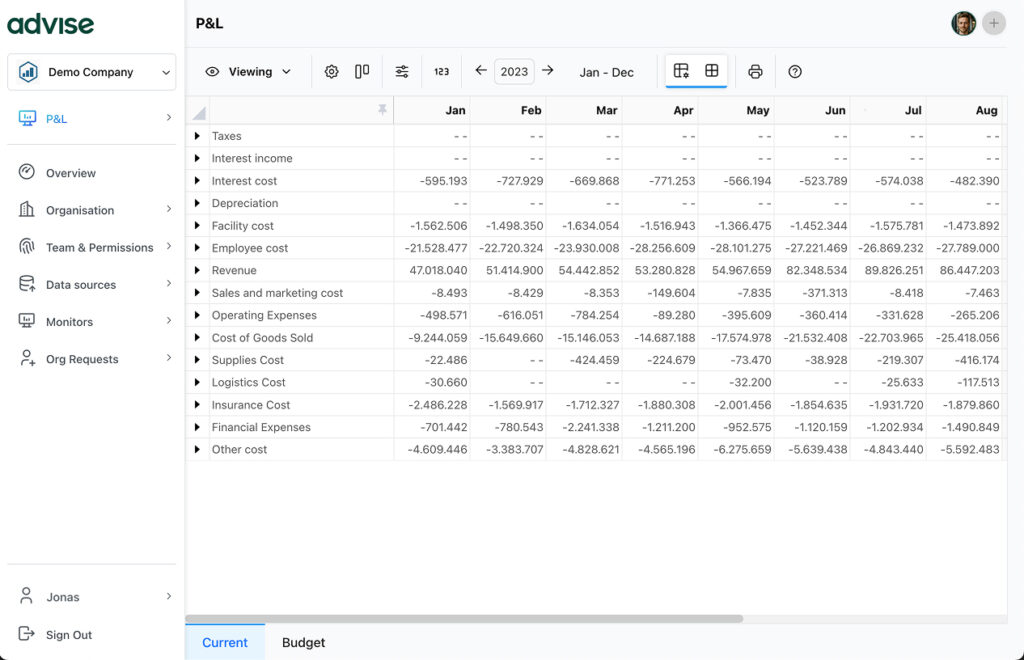
Explore the actual table
After closing the categorisation panel, you will see that each category now appears as a row showing monthly totals and year sums.
This is your first look at the Actual table—a live view of your financial data, structured and ready for analysis. You’ve now built the foundation of your Business Monitor.
👉 Ready to connect?
Head over to your Datasources panel and start turning your data into insight.