
Turn Your Table Into a Complete Report
Add the finishing touches that turn your data into a powerful reporting tool.
What you’ve accomplished so far
If you’ve completed the previous courses, you’ve already accomplished a lot.
You’ve created your organisation workspace, connected a live data source, built your first Business Monitor, and categorised your accounts. That means your Actual table is now automatically populated with monthly totals for each financial category — a clear, time-based summary of your real business performance.
Now it’s time to take that foundation and build a complete report by adding key row types like labels, calculations, manual data, and cross-references. These elements will help you tell a clearer financial story and create a report structure that’s ready for budgeting and dashboards.
Course goal
Learn how to fully structure your Actual table using different row types to turn categorised data into a comprehensive financial report.
Before You Begin

You should now have:
- An organisation workspace
- A connected datasource
- A business monitor with categorised accounts
What You’ll Learn
- How to enter Edit Mode
- How to use and configure:
- Label rows
- Spacer rows
- Calculation rows
- Manual Data rows
- Cross Reference rows
- Label rows
How to customise and reorder your table
Step-by-Step: Enrich Your Actual Table
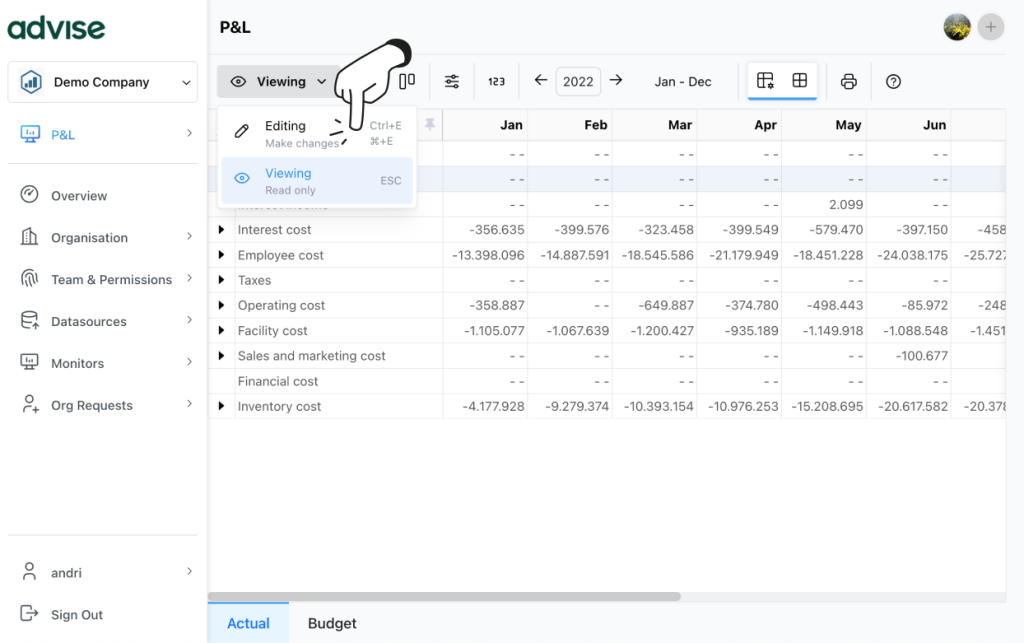
1. Enter Edit Mode
From the Monitor’s header, switch from Viewing to Editing.
A new left-side Table Elements toolbar will appear.
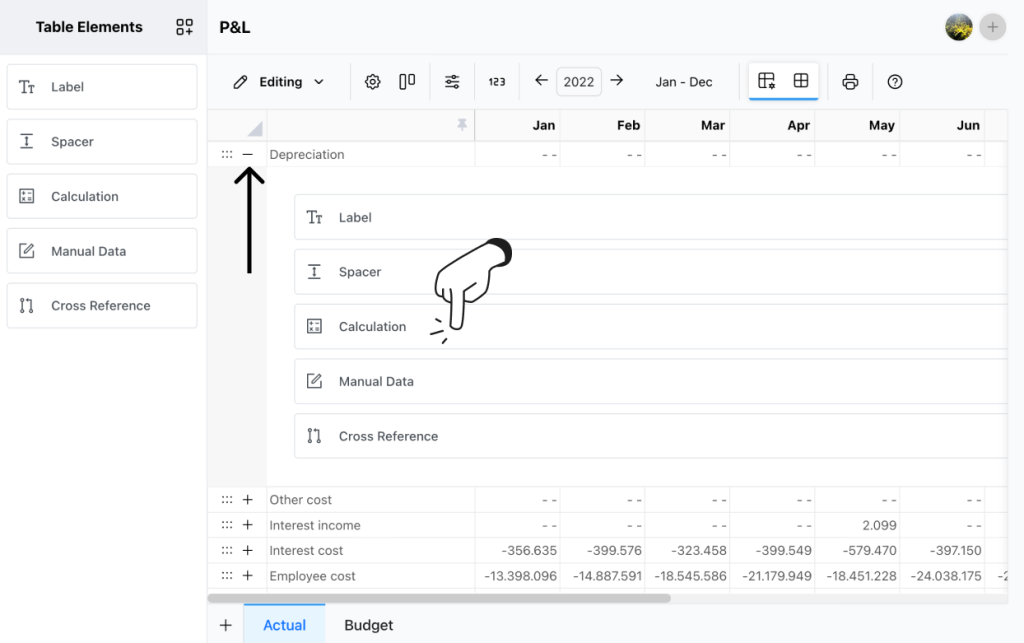
2. Understanding row types
Use these to make your report clear, flexible, and insightful:
- Label: Add section headers to your table like “Income” or “Operating Expenses”
- Spacer: Add whitespace to visually separate sections
- Calculation: Define formulas using @ to reference other rows (e.g. @Total income – @Total costs)
- Manual Data: Add rows where you input values manually (like Quantity Sold)
- Cross Reference: Pull in a row from another monitor
Each new row can be added from the toolbar or at a specific place by clicking the + icon next to an existing row. Let’s create your first calculation row by clicking on the Calculation item.
Creating a Calculation Row
After adding a new calculation row to your table, the configuration panel will appear on the left. Start by giving your row a clear title. Then, build your equation by typing @ in the equation field — this will open a list of available rows you can reference in your formula.
Select the rows you want to include, and write out the calculation using standard math operators (+, -, *, /).
Example:
Title: Total Cost@Financialcost + @Othercost + @Interestcost + @Employeecost + @Salesandmarketingcost
Hit the Save button to save your formula — your new row will be calculated automatically, and the monthly columns will populate with results.
Row Configuration
Each row has two config tabs in the left tool panel:
- Content – Adjust what the row shows (label text, formula, source monitor etc.)
- Styles – Set colours, alignment, borders, and more
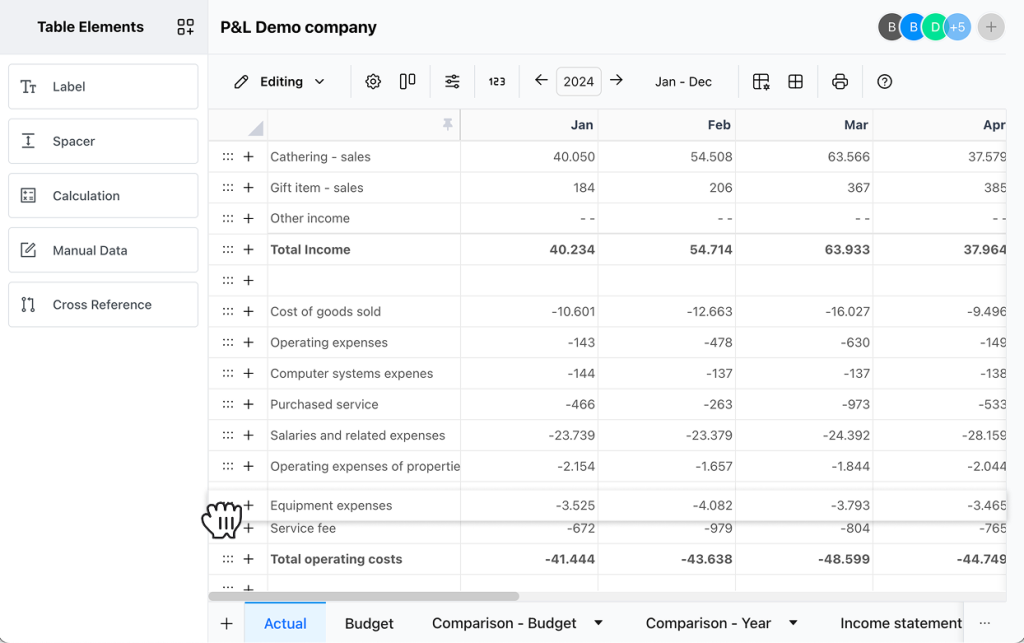
Step 4: Rearrange Your Rows
Make sure you’re in Editing mode. To move rows around, use the drag handle — the six-dot icon on the left side of each row. Just click and drag the row to reorder it within the table.
When You’re Done
Switch back to Viewing mode to lock in the structure. Your Actual table is now the analytical backbone for:
- Budgets
- Dashboards
- PDF reports